Welcome to the Tap Blog - The Home for Media Sceptics

The blog that’s fed by the readers. Please send in the news and stories that you think are of interest to an awakened audience. Read more...


Government’s Notorious ‘1 in 3’ Propaganda Line Doesn’t Square With ONS Data

Wrong!

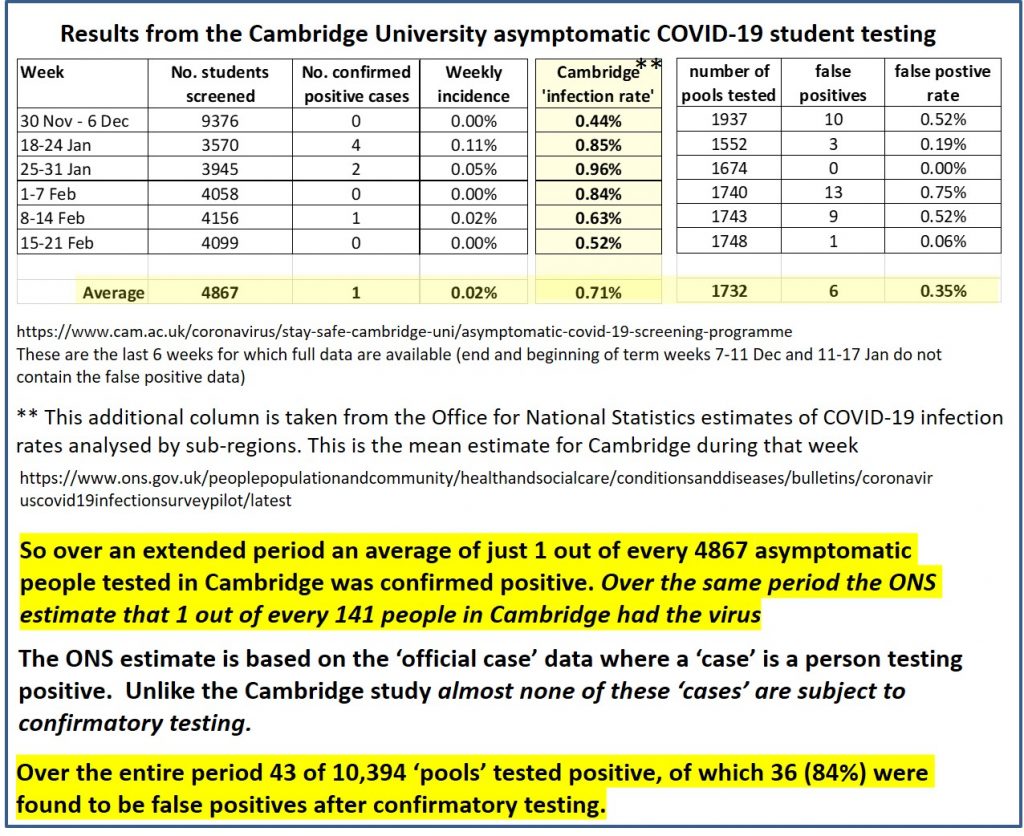
Norman Fenton, a Professor of Risk Information Management at Queen Mary University has analysed the data from a study of ‘asymptomatic cases’ in Cambridge and published his conclusions in a blog post:

The Cambridge study testing asymptomatics is the gift that keeps on giving

This makes interesting reading for anybody who still believes the Government ‘case’ data and the claim that just because you don’t have any COVID-19 symptoms it doesn’t mean you aren’t an danger.

This data also means that if the Government claim that “1 in 3 people with the virus has no symptoms” is correct then the ONS estimated infection rate is massively inflated – the currently reported ‘case’ numbers must be at least 8 times greater than the true number of cases. On the other hand, if the Government estimates of case numbers are correct then at most 1 in 26 people with the virus has no symptoms. Here’s an informal explanation why (formal proof is below):

Cambridge has a population of 129,000.

If the ONS infection estimates for Cambridge (0.71%) are accurate, then during an average week in this period about 916 people had the virus and 128,084 did not.

But if the “1 in 3” claim is correct about 305 people in Cambridge had the virus but no symptoms.

So at most 128,389 people in Cambridge had no symptoms and that means at least 305/128389 people with no symptoms had the virus. That is at least 0.24% (i.e. at least around 1 in 421).

But the study shows on average only 1 in 4867 (0.028%) with no symptoms had the virus. So there should only have been about 36.

That means the “1 in 3” claim and the ONS estimates cannot both be correct. 

If the “1 in 3” claim is correct, then the maximum possible value for the infection rate is 0.084% and not 0.71% as claimed (with 0.084% we would have 108 with the virus of whom 36 have no symptoms). So the ONS estimated infection rate is over eight times greater than the true rate. 

If the 0.71% infection rate is correct, then the maximum possible value for the proportion of people with the virus who have no symptoms is 3.9% (as this would mean 36 of the 916 people with the virus have no symptoms as predicted by the Cambridge data).

Worth reading Professor Fenton’s conclusions and workings out in full.

https://lockdownsceptics.org/

THE TAP NEWSLETTER
Get the latest posts by email
Share this

Alternative View Videos

Videos supplied by Alternative View Media. All ticket purchases help keep The Tap Newswire going.

How to Watch

To watch please click on the video and purchase a ticket. Once you have made your purchase you will be sent an automatic email confirmation with your password details Important: Please check your spam folder after your purchase. If you don't receive your password within 10 mins please contact us. We also have a help page.

David DuByne - Embrace the Awakening, Embrace the Cycle: The Water Bearer Returns

We see vast changes are occurring in every aspect of life exactly at the same time across the entire planet. Ask yourself why, and why at this time when vast electromagnetic Earth changes are timelined out through October 2024 as the four gas giants form a square in the outer solar system that was last seen in 79 A.D, that our world is radically changing.


Johan Oldenkamp - The Giza Star Clock and the Transition of the Ages

In addition to the three larger pyramids, there were in total also eight smaller pyramids on the Giza plateau in Ancient Egypt. To many, it is clear that the three three larger pyramids refer to Orion’s Belt. These three pyramids were built below on the surface of our home planet, just as these three stars are above in the sky (“As Above, So Below”). More info...

Johan Oldenkamp Website:

www.pateo.nl


Mark Steel - The Covert Asymmetrical 5G Led Warfare Agenda

The secret agenda behind - Build Back Better - World Economic Forum globalist push of political ideological unification - asymmetrical 5G warfare plan – electrifying digital agenda including AI trans-human augmentation – Covid-19 technology injection and the UN smart cities – UN 2030 net zero carbon implications. More info...

Mark Steel Website:

www.saveusnow.org.uk


Ian Simpson Geo-Engineering Presentation

Ian Simpson woke up in April 2013 and almost immediately realised that what he saw happening in our skies was very serious and had to be exposed. More info...

Ian Simpson Website:

www.look-up.org.uk


Gary Fraughen and Arthur Piotrowski Presentations

Subjects covered include: The 5 elements, money, promissory notes and the occult, AC and DC current, Tesla, cities as circuit boards, cathedrals, Schumann resonators, fingerprints and DNA, graphene oxide, medical interventions, the war on men, third strand DNA, red shift, blue shift and much more. More info...

Gary and Arthur Websites:

Gary Fraughen - www.garyfraughen.co.uk

Arthur Piotrowski - www.thelawoffrequencies.com