
The Government’s Website Needs Updating
Sun 12:10 pm +01:00, 14 Feb 2021
The above banner on the GOV.UK site makes two alarming claims about the state of COVID-19 in the United Kingdom: First, that it’s spreading fast, and, secondly, that one in three people who have the virus have no symptoms. Lets take those in order.
Reports come in daily at the moment about the declining rate of infection. According to the latest, from MailOnline:
The UK has recorded another 13,308 coronavirus infections – down 27% on last week.
Daily deaths have also dropped by a quarter to 621 taking the total to 116,908 – although separate figures suggest the number could be much higher…
It marks the third Saturday in a row where deaths have dropped week-on-week.
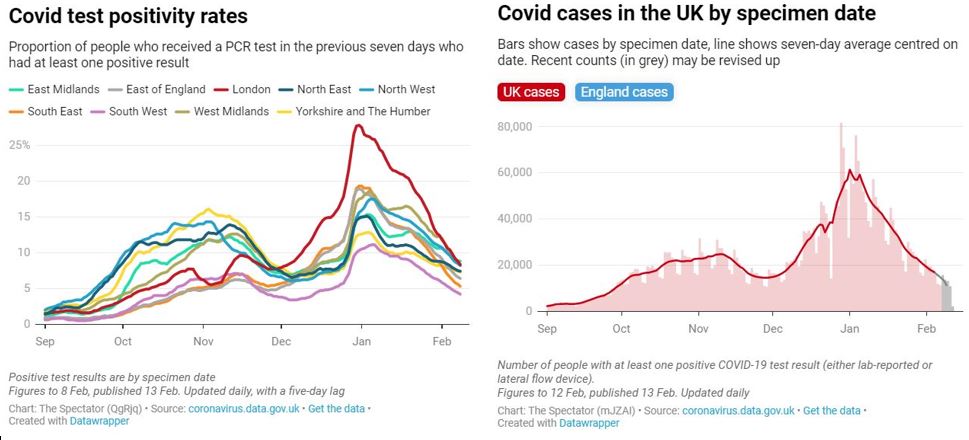
To put this into context, here are a couple of good graphs from the COVID-19 data-tracker at the Spectator, taken from the GOV.UK coronavirus dashboard.
What about the R number? These estimates all come from Professor Philip Thomas, University of Bristol, the ONS, the Imperial College REACT study and the UK.GOV coronavirus dashboard and all put the number below 1:
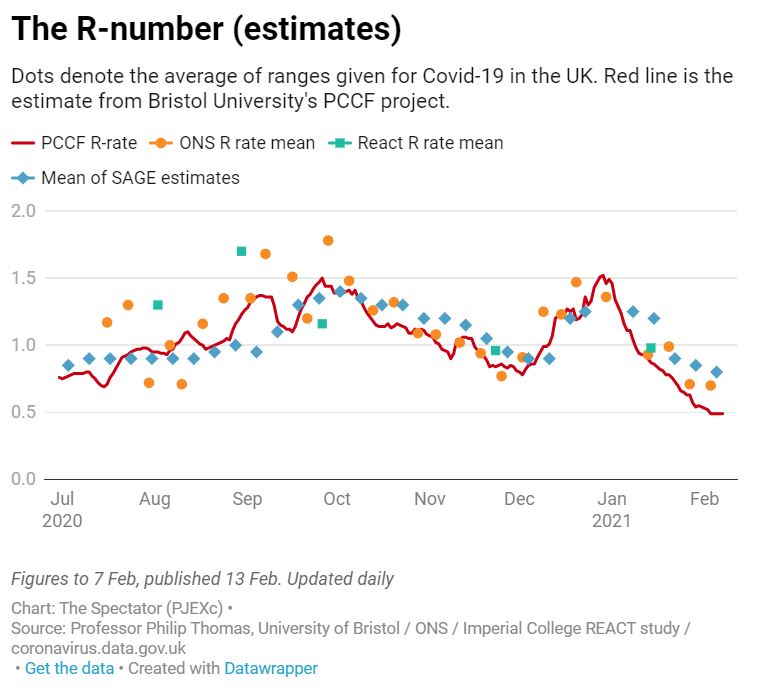
The GOV.UK page on the R number confirms this.
Latest R range for the UK: 0.7 to 0.9
Latest growth rate range for the UK: -5% to -2% per day
An R value between 0.7 and 0.9 means that, on average, every 10 people infected will infect between 7 and 9 other people.
A growth rate of between -5% and -2% means that the number of new infections is shrinking by between 2% and 5% every day.
So still spreading, but perhaps the banner should read “Coronavirus (COVID-19) is slowing down”. It could speed up again, I suppose, but at this particular moment in time it is slowing down.
Leaked NHS data shows that hospitalisation are shrinking at a faster rate than predicted, with hospital admissions and deaths projected to halve over the next month.
The second claim in the banner, that “one in three people who have the virus have no symptoms, so you could be spreading it without knowing it” is debunked on the Probability and Risk blog maintained by Norman Fenton, a maths professor at Queen Mary, and Martin Neil, a computer science professor at Queen Mary and a contributor to Lockdown Sceptics.
Based on data provided by the UK Government, the Worldometers website estimates the number of active cases on any given day. In the week of 1st – 7th Feb the average daily number of active cases in the UK was 944,650. But not everybody who has the virus gets tested, so assuming testing is accurate, the true number of active cases must be higher than this. If we use the Government “1 in 3” claim – together with reasonable assumptions about the proportion of people with and without symptoms who actually get tested – then the ‘true’ number of active cases would have to be about 1.4 million, which represents just over 2% of the population (see the detailed analysis).
Combining the Government’s claim and an assumption of a 2% active daily infection rate, means that 0.711% of the population who had no symptoms must have had the virus, for the period 1st – 7th Feb (the detailed analysis provides the full Bayesian calculation). So, if we randomly tested 10,000 people without symptoms, during that week, we would expect to have found that about 71 tested of these people would test positive.
We can empirically test the implication of the Government’s claim that 0.711% of the population who had no symptoms must have had the virus, using an ongoing study at Cambridge University to do so. This study is testing students without symptoms and, for the week of 1st – 7th Feb, reported that a total of 4058 students with no symptoms were tested. Given this number, and the government’s claim, we should have expected to see that 29 of these 4,038 should have tested positive. But how many did test positive? If it is a lot less, then the Government’s claim must be wrong. In fact, none tested positive!
They have come up with a different estimate of the percentage of people with the virus who are asymptomatic – and it’s a lot less than one in three.
Taking proper account of uncertainty, as explained in the detailed report, we estimate there is a 95% probability that the true proportion of people with COVID-19 but no symptoms is between 0.65% and 7.19% with mean 3.077%. So, between as few as 1 in 153 and as many as 1 in 14, with a mean of 1 in 32.
Worth reading in full.
The second claim in the GOV.UK coronavirus banner, therefore, is in need of some revision.
Stop Press: Faulty estimates of the number of asymptomatic cases may have led Swedish authorities to overestimate the level of immunity last year, according to Anders Tegnell. The Telegraph has more.
Dr Anders Tegnell, Sweden’s state epidemiologist who devised the no-lockdown approach, said the level of immunity populations had against the virus was “an enigma and mystery” in the early stages of the pandemic.
COVID-19 was perhaps falsely compared with flu, when a large proportion of people catch it and show no symptoms, recover, then develop antibodies, said. Dr Tegnell.
This resulted in Sweden believing more people had developed immunity than was accurate, he explained.
“We thought that it would be similar with COVID-19 – that we would have quite a large part of people that actually develop antibodies with very low levels of symptoms and didn’t show up in health care,” Dr Tegnell told the Oxford Union this week.
“That has proven to be not right because immunity in the population has developed much much lower than I think anybody expected in the beginning. A lot of the initial modelling stuff was also having that assumption and it didn’t turn out to be the case.”
Worth reading in full.
https://lockdownsceptics.org/


