
Where’s the Pandemic?
Wed 11:08 am +01:00, 6 Jan 2021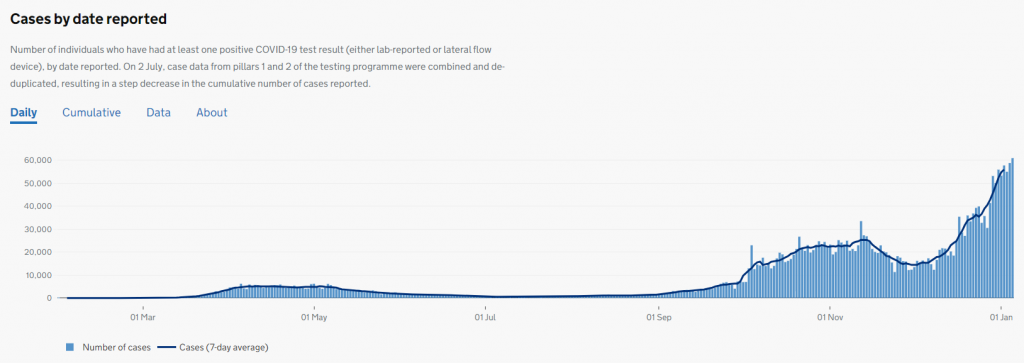
Cases are soaring, with a record 60,916 new cases reported yesterday. Hospital admissions for Covid are going up and up. Deaths are in the hundreds per day and increasing. Only an idiot would doubt we’re in the midst of a serious pandemic, right?
Except all these figures that show there’s a deadly pandemic raging are based on mass testing using PCR and more recently lateral flow tests. Cases are just positive tests. Hospital admissions are just people in hospital who test positive (and all patients are tested). Deaths are just people who die of any cause within 28 days of a positive test.
To get a true picture of what’s going on you have to look at data that are independent of PCR tests. So overall hospital and ICU occupancy, excess deaths, emergency calls for flu-like symptoms and so on. Strikingly, these data all speak in unison and tell a very different story.
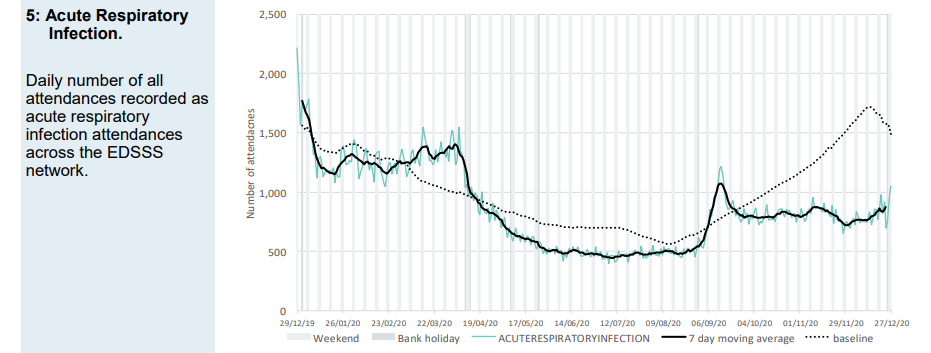
Look at the graph below of A&E attendances in England for acute respiratory infections (which include COVID-19). It’s trending well below baseline and, save for a September spike leading into elevated winter levels, been almost flat since the spring.
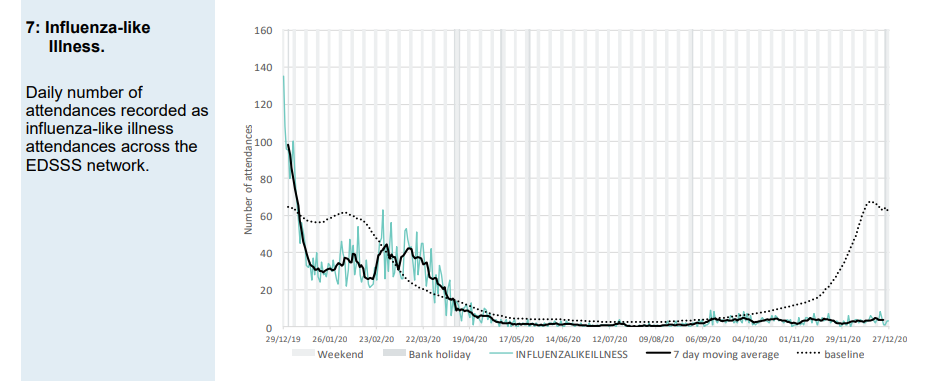
What about flu-like illness? Flat and well below baseline since spring.
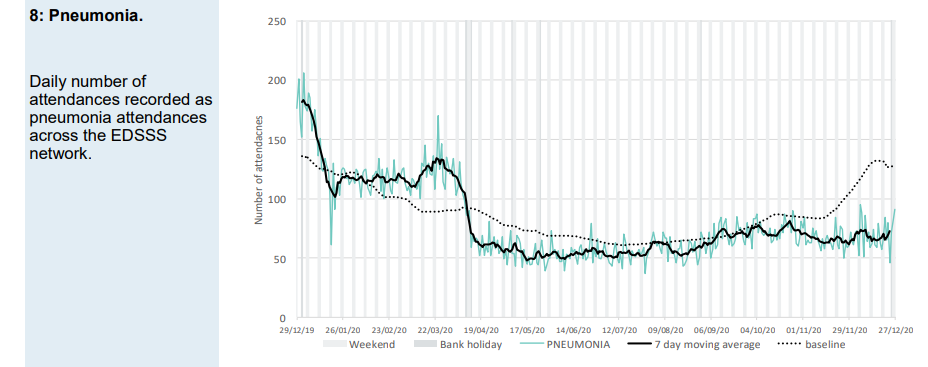
Pneumonia? Also flat and well below baseline.
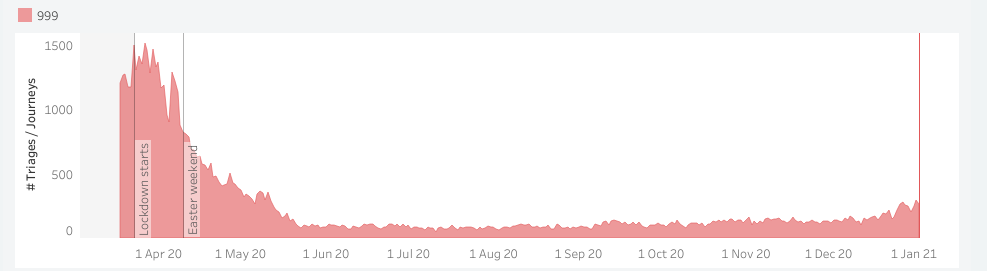
999 calls for Covid-like symptoms? Largely flat since spring, though up a little in the last few weeks.
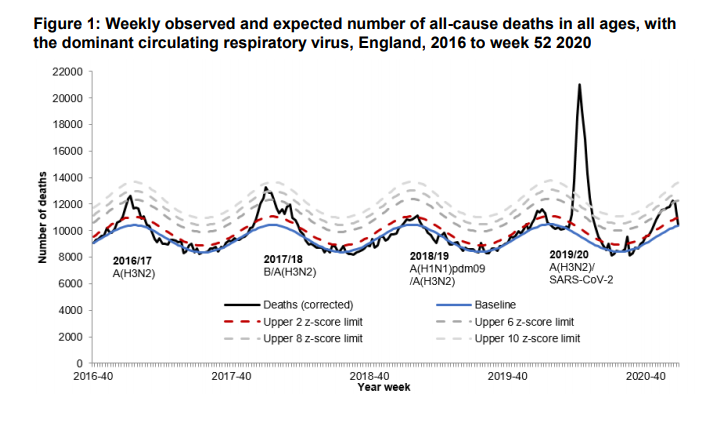
Deaths? Nothing out of the ordinary for winter. As PHE state in their most recent report: “In week 52 2020 in England, no statistically significant excess mortality by week of death… was seen overall”.
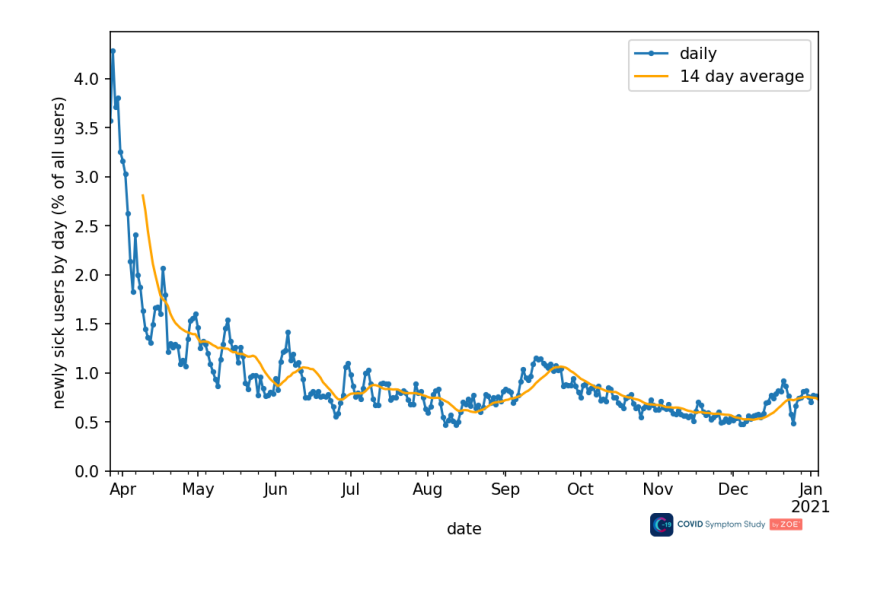
There are also the reports of Covid-like symptoms that users of the ZOE app send in each day, prior to any PCR tests being carried out. Like the other symptom-based data, these are largely flat since spring.
Much is being made of the current pressure on the NHS, but in reality there is a winter beds crisis in the NHS almost every year, and hospital occupancy rates this winter are similar to previous years. Some areas like London are currently under pressure, but that is mainly due to staff shortages – up to a third are off sick or self-isolating – and additional Covid constraints that have reduced the availability of beds and increased staff workloads.
Lockdown Sceptics regular Dr Clare Craig has gathered all this data together in one place and added a commentary explaining what it means. She says:
One thing that Public Health England has been world beating for before and during this pandemic has been the sharing of data. Data is collected from every aspect of the healthcare system and we now have the full dataset for 2020. The beginning of the graphs therefore give an indication of the levels expected at this time of year.
A selection of this data is presented that tells the story of a Spring pandemic. However, what this data reveals about Autumn and Winter does not fit the hypothesis that there has been a second wave. PCR testing results are an outlier in the data and only data related to PCR test results has led to the impression that there is currently a Covid problem.
Well worth reading and sharing.
https://lockdownsceptics.org/


