ICU Occupancy Still Below Average
Fri 11:47 am +01:00, 1 Jan 2021
On Monday, we noted that ICU occupancy on December 20th in NHS hospitals in England was lower in absolute terms in four out of seven NHS England regions than it was in December 2019. If you measured ICU occupancy as a percentage of all ICU beds available, it was lower in all seven regions.
Several people pointed out that our figures were out of date. Since December 20th, we were told, ICU occupancy had increased dramatically thanks to the spike in Covid admissions caused by the new variant.
We now have the figures for Dec 27th and while there are more ICU beds in use, the situation hasn’t changed dramatically.
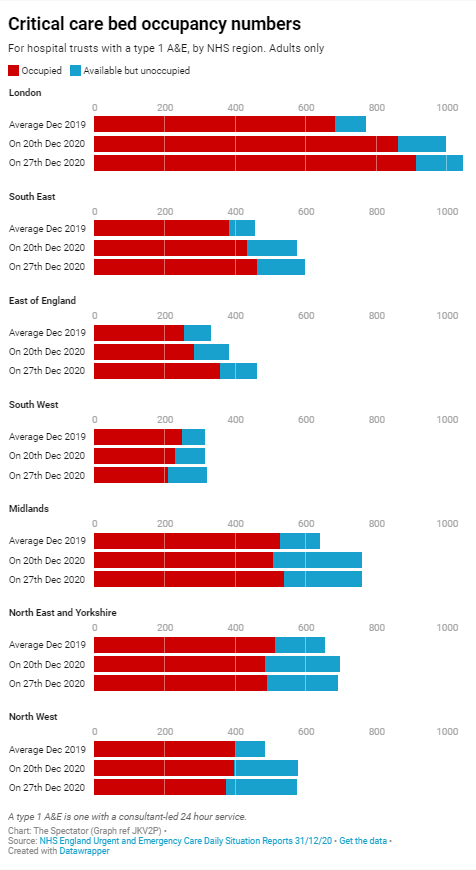
First, let’s look at the total number of ICU beds occupied in the seven NHS regions.

It’s true that the total number of ICU beds occupied in London, the South East and East of England on December 27th was higher than the December average last year, but in three of the seven regions it was lower (the South West, North East and Yorkshire, North West) and in the Midlands it was only fractionally higher. So not much change, then.
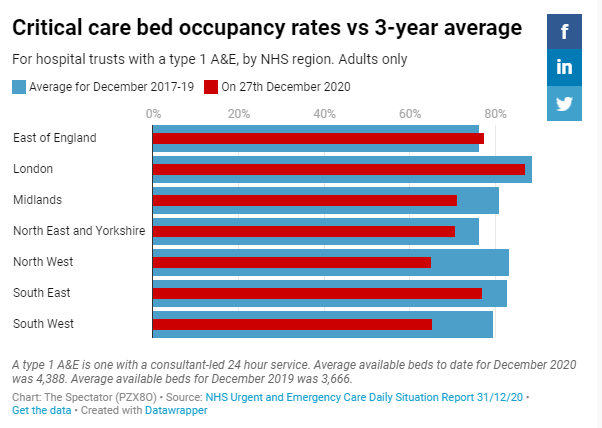
What about the percentage of ICU beds occupied on December 27th compared to the three-year average for December? Again, not much change.

As before, in six of the seven regions the percentage of critical care beds occupied on December 27th was below the December average for the past three years and in only one region – the East of England – has it climbed above. True, the number of available ICU beds increased between December 2019 and December 2020, but the fact that capacity hasn’t been exceeded in the vast majority of areas suggests that, contrary to the impression given by the BBC (see below), the NHS isn’t at breaking point.
https://lockdownsceptics.org/


