
“Highly Contagious” New Variant Dipped in November
Thu 10:42 am +01:00, 7 Jan 2021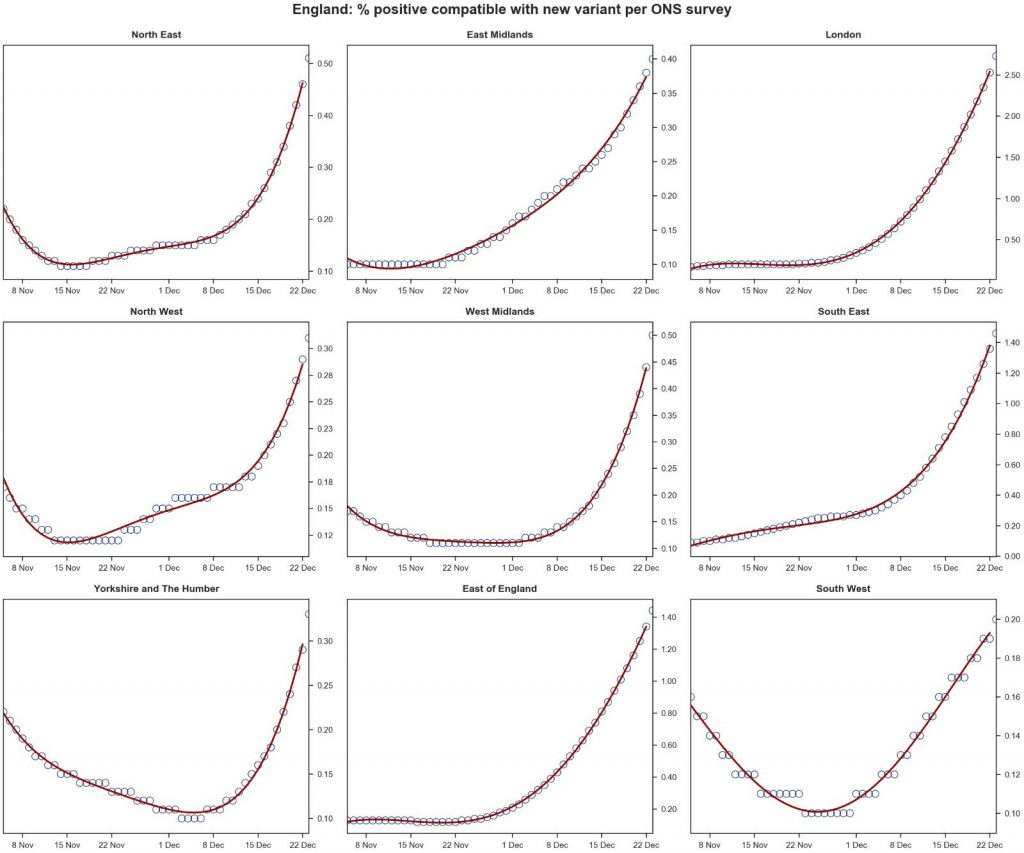
Software Engineer and Lockdown Sceptics regular Mike Hearn has dug into the data on the “70% more transmissible” new variant and found something curious: its prevalence dipped before it surged. Over to him.
The graphs of the new variant by region presented by the Government make it look like the new variant starts out near zero everywhere on November 22nd and then starts growing. However, this is due to graph truncation and unfortunate choice of Y axis. The ONS dataset released on December 30th has data going back further. Above is a similar plot to what the government presented but with the full data and a more appropriate scaling.
This reveals something problematic: in some regions the decline in prevalence during November was of the same order of magnitude as the increase during December. This contradicts the claim that the new variant is highly infectious. If that were true, all these graphs should be unambiguously up and to the right for the whole time-series.
The ONS spreadsheet says we should ignore data pre-dating mid November:
There are also other reasons why a swab may be positive for only these two genes, including lower viral load in the sample, which is why we have always seen a small percentage of this type of positive result. Our data suggests the dropping of the S-gene became a relatively reliable indicator of the new variation in COVID-19 from mid-November. Prior to that, the data should not be read as being an indicator of the variant.
There are two problems with this statement:
- It’s not an explanation: just an assertion that for “data” reasons the meaning of the S-gene dropouts changed completely during November. The ONS is meant to make data transparent but here that’s not happening. What data suggests this, how is it being interpreted and what was the biological meaning of S-gene dropouts before mid-November, if not this new variant? It can’t be just test noise because the levels at the start of the time series in Yorkshire and the South West were very far from their lowest points.
- At some point “mid November” became November 22nd, although that isn’t actually the middle of November. This vagueness suggests that the decision of where to draw the cutoff isn’t data-based at all, but instead might be driven by an attempt to hide the declines while still having enough data in the series to seem credible given the timing of the second variant announcements.
My guess is a combination of two things is going wrong here:
- When epidemiologists tried to explain the run-up in cases they were informed of the sequencing of the new variant without being given the precise dataset we are looking at now. They proceeded to make a correlation-implies-causation based conclusion, without realising there was no actual correlation.
- They opted for blaming the new variant rather than the more obvious explanation that respiratory diseases always go up in winter, because one curious feature of epidemiological models is that they don’t seem to incorporate seasonality or in fact, any notion of absolute time at all. If you read the code of these models you’ll see that time is measured as “days since start of epidemic”. This is because their models aren’t able to predict when epidemics start or why, so can only be run once an epidemic has already started. This puts the model into an effectively non-seasonal world in which all days are created equal.
- When the discrepancy was realised it was too late and the train was already in motion, so this explanation that the signal meant something different before November 22nd was created. The lack of detail and apparent contradictions are evidence of the attempt to reconcile the contradictory output of epidemiological models with the lab reported data.
Lockdown Sceptics quoted Sir Desmond Swayne as saying: “I’m deeply suspicious of the science, and the fact is that we’ve been bounced again. The Government lacks the scientific and statistical expertise to ask the right questions and review the data and modelling.”
Sir Desmond is correct to be suspicious. Dropping data points that undermine your hypothesis is something high school students are taught violates the scientific method, yet it’s been a recurring feature of epidemiology throughout 2020. What’s presented to us as “science” is in reality pseudo-science – that which has the superficial look and feel of something scientific without actually being so. Occasionally the mask slips. After my code review of Imperial College London’s COVID-19 model was picked up by the press, ICL announced that “the conclusions around lockdown rely not on any mathematical model but on the scientific consensus that COVID-19 is a highly transmissible virus”. In other words although we’re presented with data and modelling, it’s ultimately all just for show: what matters most in this community is not scientific truth but friendly agreement.
https://lockdownsceptics.org/


