
Top Doctor Says NHS In Contempt of Parliament
Mon 10:01 am +01:00, 9 Nov 2020
What follows is a guest post from my doctor friend who has cast his eye over the latest weekly data released by NHS England. He believes the NHS was wrong to withhold crucial data from MPs ahead of the vote on Lockdown 2.0, creating the impression that the service was on the brink of being overwhelmed when Sir Simon Stephens and others knew perfectly well that it wasn’t.
On November 4th, the British Parliament voted to enforce a lockdown of the population in order to prevent the NHS from being overwhelmed with COVID-19 admissions.
In support of the Government, Professor Whitty and Sir Patrick Vallance provided graphs of dubious provenance suggesting catastrophic consequences if lockdown was not re-introduced. These projections subsequently turned out to be grossly inaccurate.
Sir Simon Stevens, the head of the NHS in England then presented figures suggesting that the NHS was in imminent danger of collapse from Covid pressures in the coming weeks. He stated that the number of Covid patients in some hospitals was greater than the number in the spring and that in total there were enough Covid patients in England to fill 22 hospitals.
Conservative MPs complained that the information they had been provided with was insufficiently detailed to allow them to make an informed decision on the matter. The motion was duly carried.
On November 5th, the NHS released weekly Covid statistics in respect of inpatients and patients in Mechanical ventilation beds (only 30% of patients in these beds are actually being mechanically ventilated).
Analysis of these figures throws up some interesting findings.
Firstly, the 850 bed Liverpool University Hospital – regarded as the epicentre of the outbreak in the North West of England.
Here is a graph of Covid patients in Liverpool.
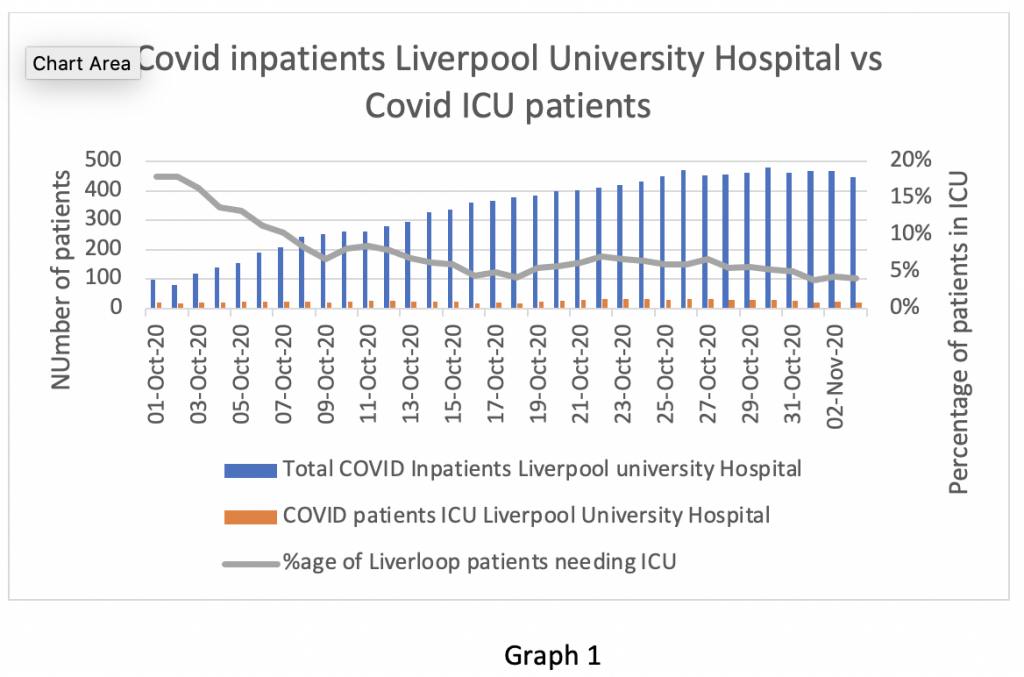
As you can see from this graph, the total number of Covid patients has been flat or declining for the last 10 days. The proportion of patients in ICU as a percentage of the total has also declined from about 17% at the start of October to 5% currently. This could mean that Liverpool has a low threshold for admitting patients from the community with Covid symptoms. Or that a substantial proportion of the ‘Covid’ inpatients in Liverpool may have positive covid tests but no symptoms of the disease.
Either way, the number of Covid patients in the ICU at Liverpool’s main hospital has fallen from 29 on Oct 22nd to 19 on November 3rd. This does not look like a hospital in imminent danger of collapse.
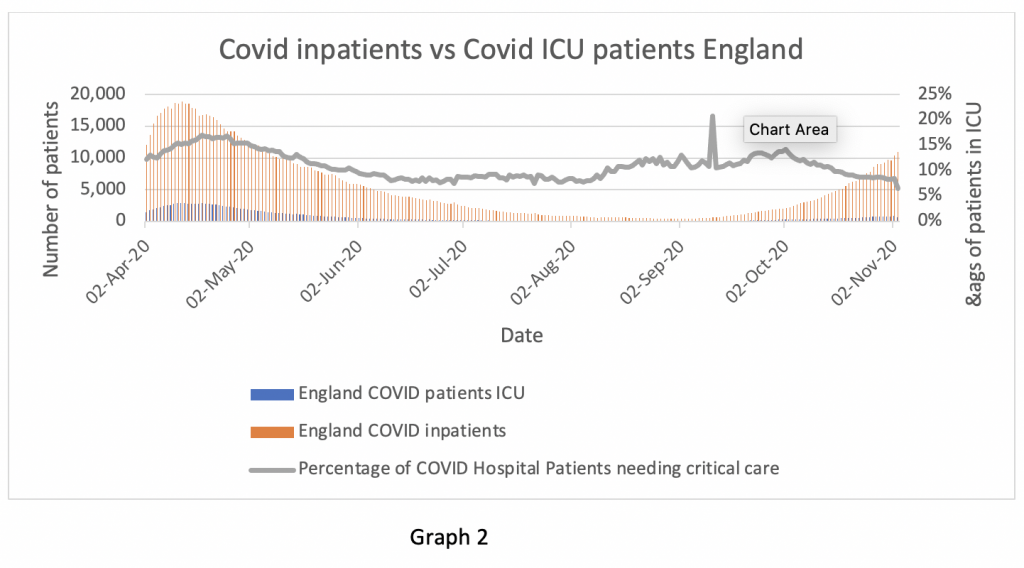
Comparing the Liverpool figures to the wider England figures shows a similar pattern – there is a clear measurement artefact on September 11th, but the percentage of Covid hospital patients admitted to ICU has fallen from 15% in the spring to 7% now, and the proportion of patients needing mechanical ventilation has fallen from 70% to under 30% (ICNARC reports). This may mean either that the severity of the disease is lower than in the spring, or the number of Covid patients in hospitals is being over-estimated by including asymptomatics. Whichever way one looks at it, the burden on the healthcare system is a lot lower than in the spring.
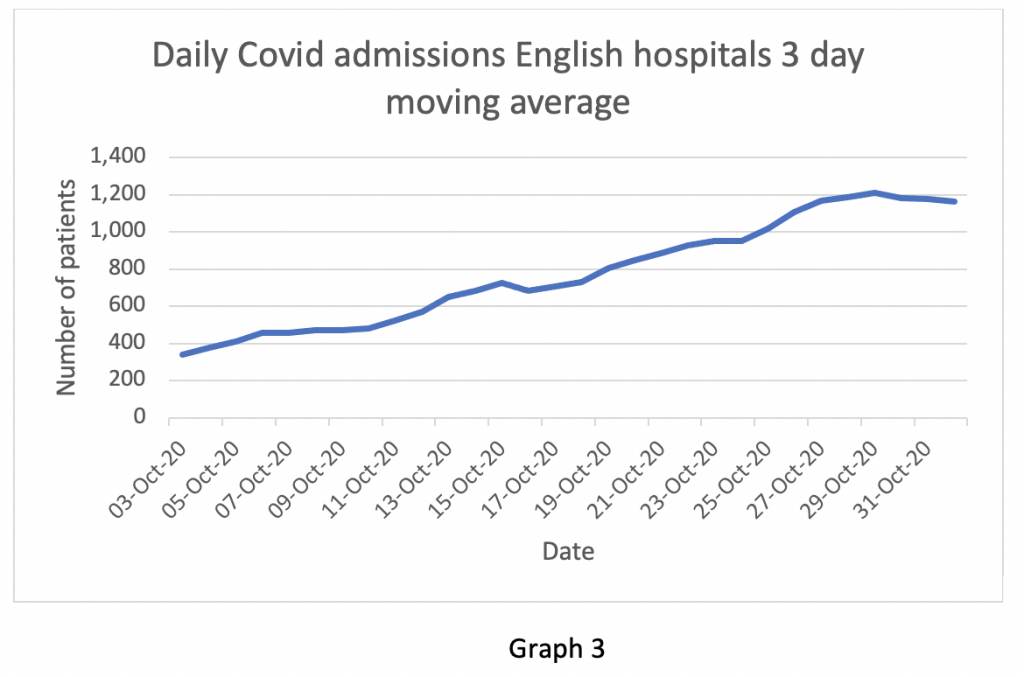
Graph 3 is a graph of the daily Covid admissions in hospitals across England expressed as a three day moving average. Seems to have flatlined for the last week. Unfortunately, Sir Simon forgot to inform the public with respect to the daily discharge figures of Covid patients, so I can’t provide a graph of how discharges compare with admissions. Anecdotally I am informed that most patients spend three to four days in hospital and are then discharged, so in many hospitals the influx of symptomatic Covid patients is balanced by discharges.
The balance between Covid admissions and discharges has troubled me for some time. Looking at the granular level data released in relation to admissions from the community and diagnoses in hospital seven days after admission, it appears that there is a very significant percentage of in-hospital infection with Covid. The NHS will not voluntarily release information about the number of patients who go into hospital without Covid but contract it having been admitted for another medical matter. The Oxford Centre for Evidence-Based Medicine has already identified this problem and the Daily Mail has submitted Freedom of Information requests to force individual NHS Trusts to divulge this information from the spring wave of COVID-19.
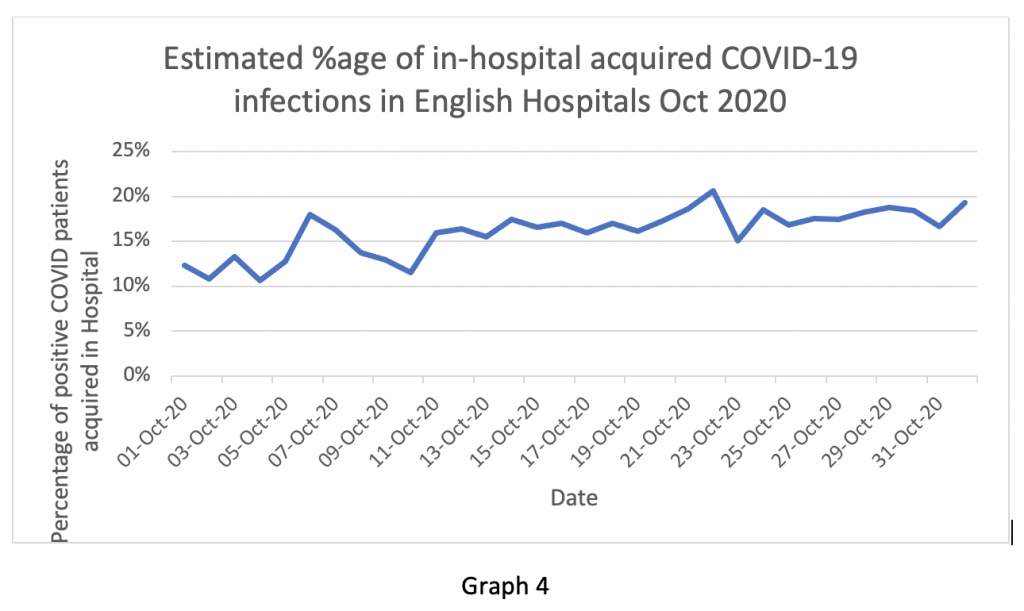
The way information is released by the NHS is difficult to interpret. Graph 4 is derived from calculating the number of patients with a positive Covid test within the last 24 hrs and subtracting from that the number of patients with a positive Covid test within seven days of admission. The difference between those two figures is probably the number of patients who tested positive for Covid from a test conducted while in hospital. It is possible that this graph may overestimate the number of in-hospital infections, but the NHS does (or should) know this figure accurately – if they don’t release the information, they can’t complain when third parties try to make reasonable estimates from the data that they do provide. By my rough calculation this appears to be running at close to 20% across English NHS hospitals. Something else Sir Simon forgot to mention.
It is disturbing that the Daily Mail has had to resort to statutory instruments such as FOI requests to extract information on hospital-acquired infections that should be publicly available. In relation to a number of highlighted cases of deaths, hospital spokespeople were quick to make the assertion that “a death with Covid does not necessarily mean a death because of Covid”. That’s a true statement, but it appears that the NHS counts all patients carrying Covid as positive cases when it suits them, and excludes the same patients from the numbers when it doesn’t.
The comment from Dr David Nicoll, a leading neurologist from Birmingham, that the NHS “acts like North Korea by obfuscating figures” is in my experience entirely accurate. Some weeks ago I wrote an article advising readers of Lockdown Sceptics to be on the look-out for NHS revision of statistics by altering counting methods, burying embarrassing information in the middle of dense spreadsheets and concealing bad news. I think the issue of hospital acquired infection is a good example.
The data released on November 5th do not support the assertion of a health service close to collapse. Further, this information was clearly available before the vote on November 4th and should have been given to MPs before the division. Data from the ONS death statistics up to October 16th suggest that there has been a slight increase in the number of deaths compared to the five-year average for this time of year. However, the deaths in hospital from all respiratory causes including COVID-19 are lower than expected for this time of year – the excess deaths are occurring in people’s homes, not hospitals. It’s extremely unlikely these excess deaths are due to COVID-19 and much more likely they are due to heart disease.
Taken together, I find this situation troubling.
Professors Whitty and Vallance present information to the public, now accepted as grossly flawed and exaggerated, in support of a Government motion to severely restrict civil liberties.
The head of the NHS presents a one-sided, unchallenged narrative of imminent healthcare collapse, without mentioning that admissions across the UK appear to be levelling off, or that the percentage of patients needing critical care has dropped substantially, or acknowledging the percentage of hospital-acquired Covid infections. Information held by the NHS executive which should be in the public domain is concealed and supressed, even from elected parliamentary representatives before a crucial national vote.
There has been no presentation to the public of the known healthcare costs of lockdown. Data on this issue will be published in the open literature in the next few weeks – too late to avert a damaging second lockdown.
Could someone explain to me why this situation does not constitute contempt of Parliament?
Dissent is suppressed by ridicule, exclusion or intimidation. Valid alternative interpretations of the data are ignored. Inconvenient metrics in relation to hospital-acquired infections or death rates are concealed. It’s not clear to me what path this Government is following, but I’m pretty sure it’s not a scientific one.
By
https://lockdownsceptics.org/


