
Boris Panics and U-Turns – Again! Lockdown 2.0 “To Be Announced Monday”
Sat 5:02 pm +01:00, 31 Oct 2020
It was reported late last night that The Prime Minister has met with ministers and aides and will announce a new national lockdown on Monday. The Telegraph has more.
Boris Johnson is expected to announce a new national lockdown next week after scientists warned COVID-19 was spreading faster than their worst predictions.
The Prime Minister spent Friday in crisis meetings with ministers and aides after being told deaths were tracking above the “worst case scenario” that suggested 85,000 in the second wave.
Mr Johnson is understood to have been persuaded that a national lockdown is the only way to save Christmas, and will spend the weekend contemplating exactly how severe it should be.
Senior government sources stressed that no final decision had been made and the measure would need to be put to the Cabinet before any announcement to the nation.
Mr Johnson is likely to summon ministers from his Cabinet coronavirus subcommittee over the next 48 hours and could hold a full meeting on Sunday if he decides he needs to act as soon as Monday. The alternative to a national lockdown would be a fourth tier of restrictions on top of the existing three tier system, but Government scientists now believe even Tier 3 is not enough to stop the spread of infections.
During the parliamentary rebellion last month the Government promised Parliament would vote on any new national lockdown measures “where possible”. Will the PM honour that? If he doesn’t, his party management problems, already considerable, will only get worse.
And what’s all this nonsense about Boris being persuaded that a second national lockdown is needed as it’s the only way to “save Christmas”? What good will it be to people who’ve been thrown on to the dole queue – or seen the businesses they’ve built up over decades go under – to sit around with their extended families on Christmas Day and pull a few crackers? Is Boris really so feeble-minded that SAGE scientists were able to persuade him to shut down the country, with catastrophic consequences for the economy, mental health and people suffering from any illness other than COVID-19, because doing so would “save Christmas”? Is he really such a sentimental buffoon?
The doom-mongering warnings come from a SAGE document dated October 14th but which appeared yesterday. It shows October is exceeding the modellers’ “reasonable worst case scenario”. Which is odd, given that daily cases haven’t exceeded the “projection” set out in the Graph of Doom. Was the Graph of Doom an unreasonable worst case scenario?
And let’s not forget that SAGE’s “reasonable worst-case scenario”, as set out by SPI-M-O in July, gets its 85,000 death total by assuming an IFR of 0.7%, more than double the latest WHO estimates. Nor should we forget that the WHO says lockdowns should only be considered as a “last resort“.
James Gallagher at the BBC has more on SAGE’s flawed reasoning.
A “reasonable worst-case scenario” is used by officials and the NHS to plan for the months ahead. It had estimated 85,000 deaths from Covid over the course of winter. But an official Sage document, dated October 14th and published today, reveals we are in a worse position than expected.
Scientists crunching the numbers estimated that, by mid-October, there were between 43,000 and 74,000 people being infected with coronavirus every day in England. Their report said: “This is significantly above the profile of the reasonable worst-case scenario, where the number of daily infections in England remained between 12,000-13,000 throughout October.”
Gallagher, who appears to take SAGE’s line on this, acknowledges that “cases” are levelling off in the North East, but fails to mention this was happening before new restrictions were introduced. He notes that R has been falling nationally for the last two weeks, but is quick to point out it is still above one, so a big problem.
The current estimate of the R number in the UK – the number of people each infected person passes the virus on to on average – is between 1.1 and 1.3. This is lower than last week’s estimate of 1.2 to 1.4, and lower than the estimate of 1.3-1.5 two weeks ago. It suggests that restrictions and changes in people’s behaviour is having an impact. But anything above an R of 1.0 means cases are still growing.
He assumes, without evidence, that it is Government restrictions which reduce R: “The national R is not below one and there will be a constant argument for tighter restrictions, in whatever form, until it is.”
Then comes the most discreditable part: an absurd attempt to vindicate Sir Patrick Vallance’s Graph of Doom.
It comes as figures from the Office for National Statistics suggested an earlier warning on Covid case numbers, issued by the Government’s Chief Scientific Adviser, Sir Patrick Vallance, has turned out to be accurate.
Speaking alongside chief medical adviser, Prof Chris Whitty, at Downing Street in September, Sir Patrick said the UK could see 50,000 new coronavirus cases a day by mid-October.
The ONS estimated that there were about 52,000 new infections each day in homes in England alone in the week ending October 23rd.
Gallagher surely knows (and if he doesn’t then he should) that Vallance was referring to reported “cases” – the daily tally of positive tests from Government testing programmes, which reached only around 16,000 by October 13th, less than one third of the projected amount. He was not referring to the weekly ONS estimates of infections. Gallagher sneakily switching to the higher figure to supposedly vindicate the prediction reeks of fudging the numbers to save the reputation of the failed prophet.
The BBC also pull one of their notoriously biased “fact checks” on hotel owner and leading Recovery campaigner Sir Rocco Forte. It’s feeble, obviously. It attempts to “disprove” Forte’s correct claim that flu and pneumonia deaths are currently running above Covid deaths by quoting the ONS death statistics for the whole year rather than just the last few months. And to counter his correct claim that modellers wrongly predicted 500,000 UK Covid deaths without lockdown, it quotes a Dr Deepti Gurdasani, epidemiologist at Queen Mary University of London, saying the Imperial model is “widely accepted as an estimate of the likely death toll from unmitigated spread due to coronavirus, if no action was taken to control it. The Government didn’t overreact, but rather underreacted. Evidence suggests that waiting on lockdown in March cost tens of thousands of lives.” I must have missed the part where Dr Gurdasani was endowed with supreme knowledge, so whenever other experts such as Professor Sunetra Gupta disagree with her it is always them who are wrong.
However, in the process of spewing forth this guff, the BBC accidentally let through a diamond of a graph that reveals how the 2020 Covid death toll is below the flu and pneumonia death tolls of the eight years between 1993 and 2000. The introduction of the flu vaccine in 2000 is credited with sharply reducing winter deaths – arguably why there are now many more elderly people vulnerable to coronavirus – though that wouldn’t explain why the figures for 1990-1992 were also much lower.
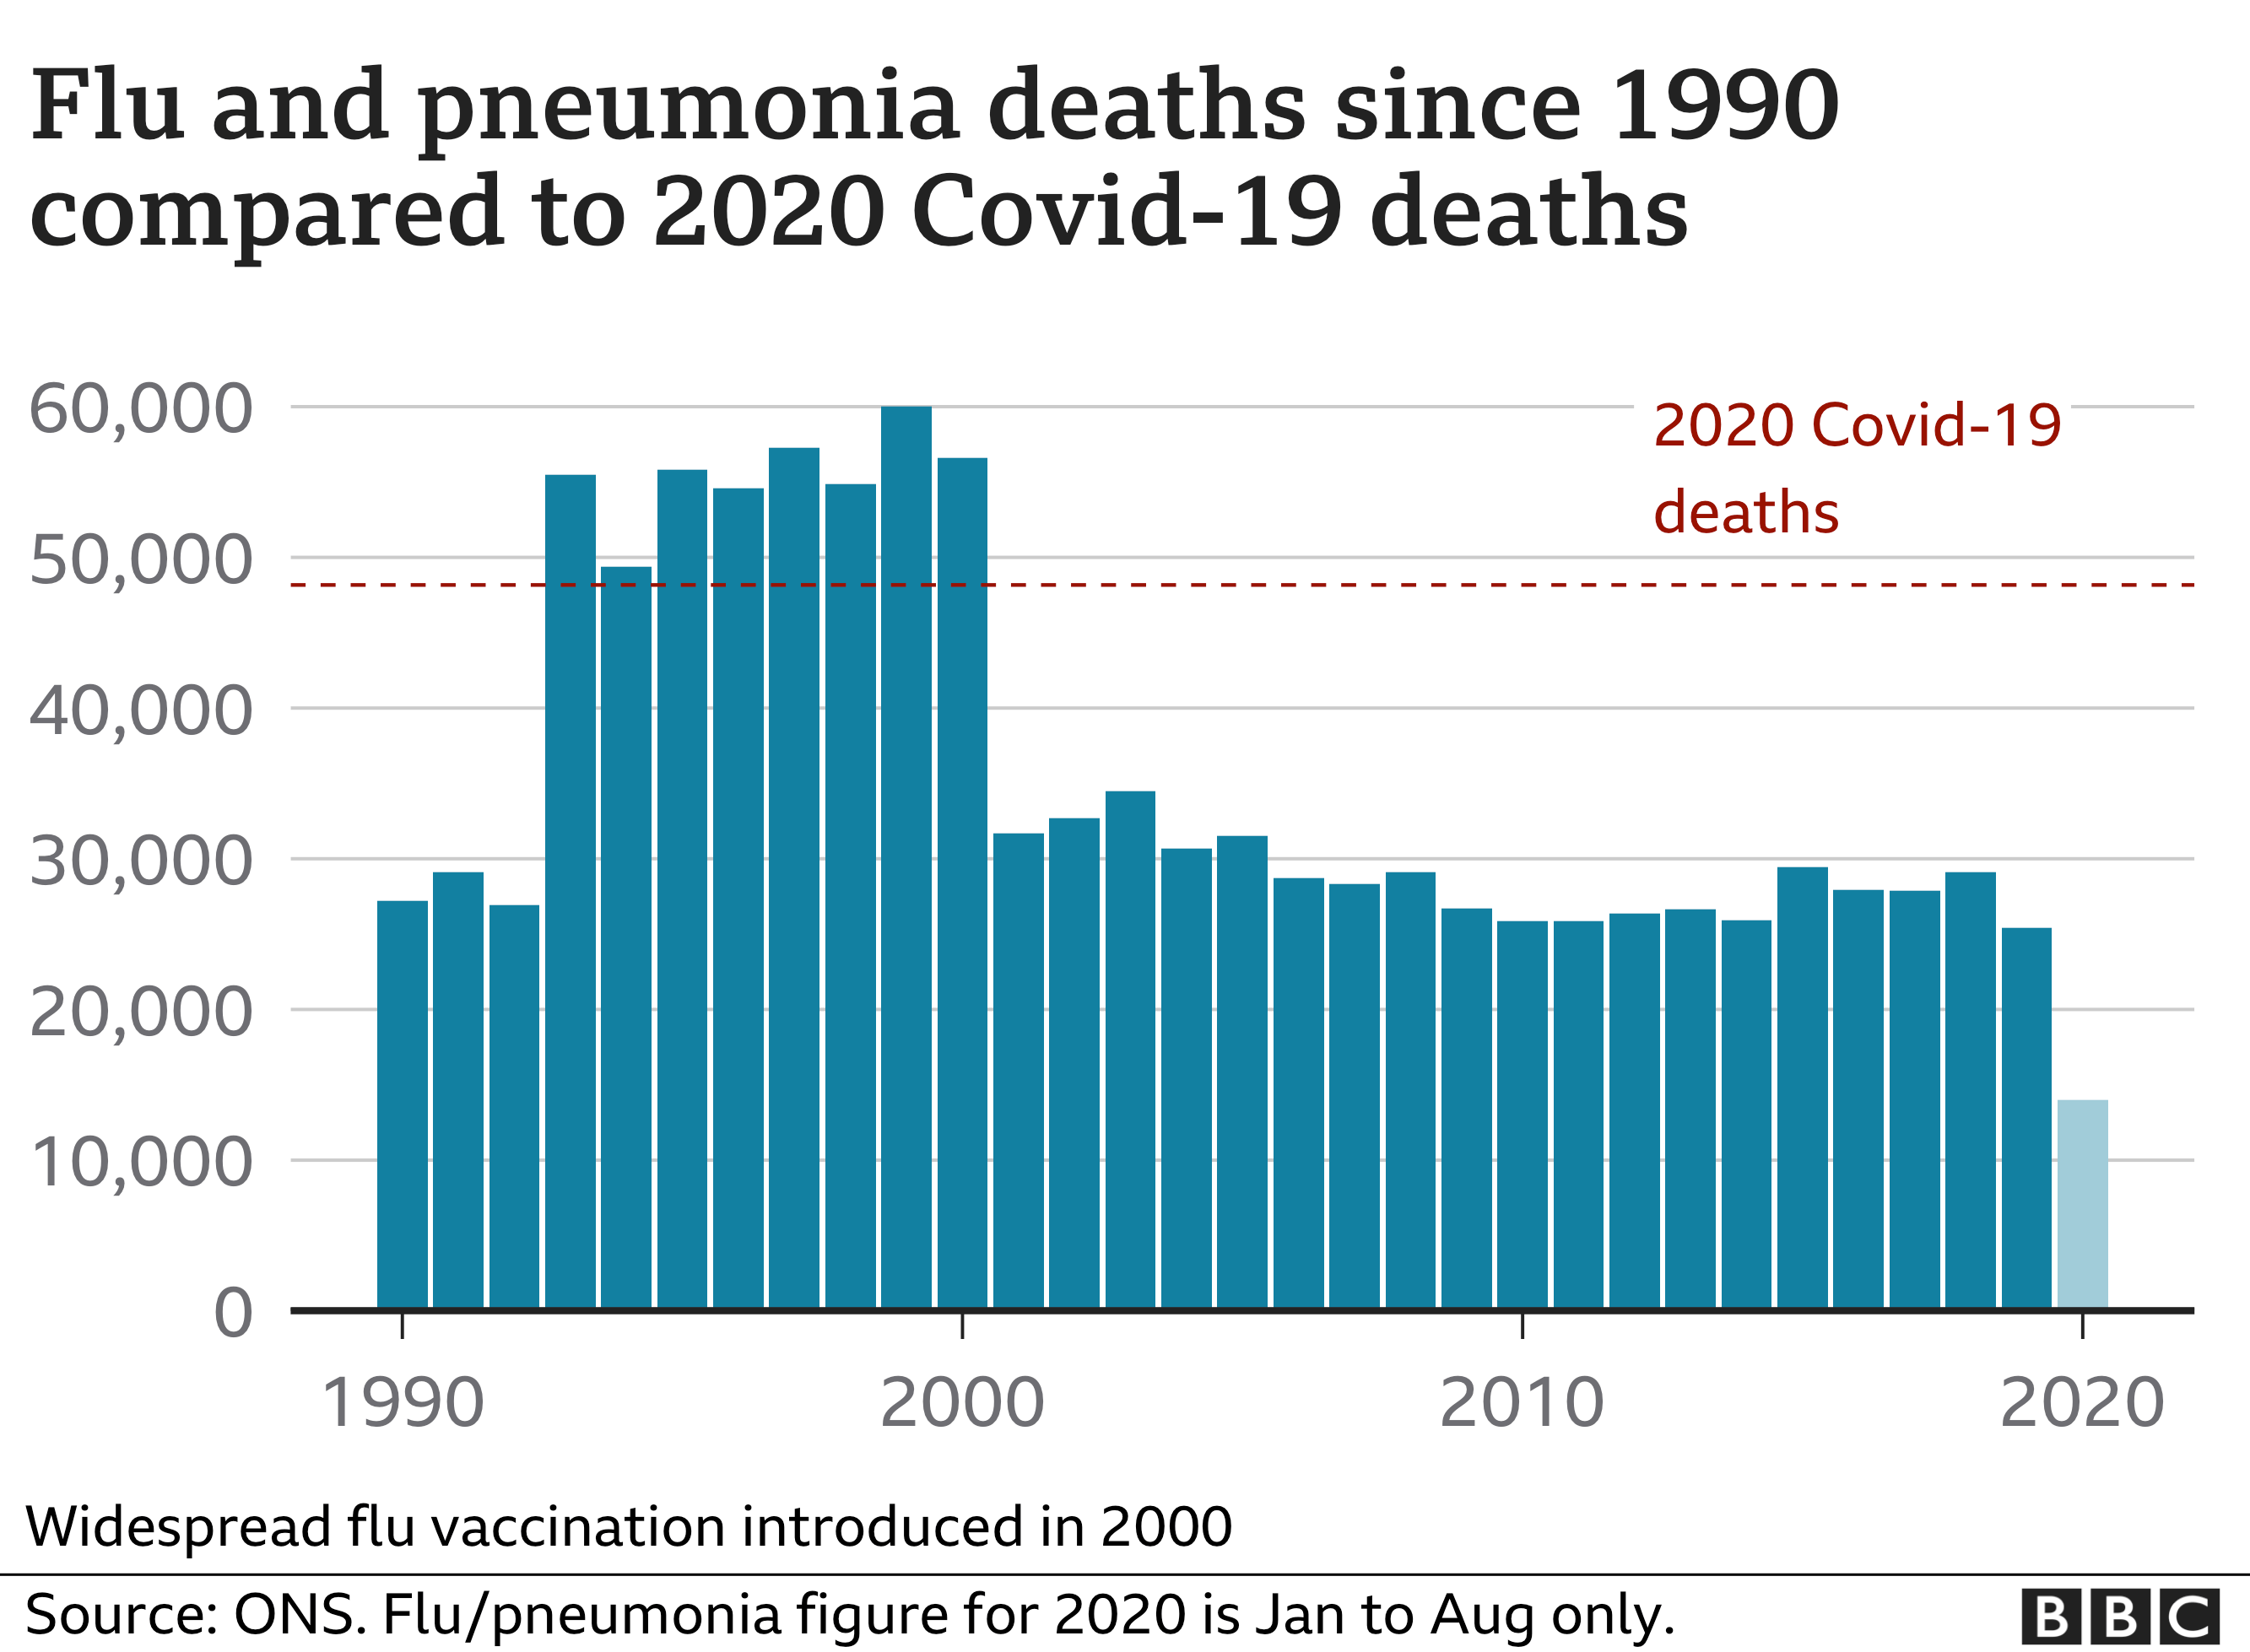
So is the Government really saying that an annual death toll that’s lower than the annual death toll between 1993 and 2000 is too high to let life continue even with the present restrictions in place? The Government is convinced the only reason the death toll wasn’t much worse was because of the lockdown – a view amply refuted by Sweden, South Dakota, Tanzania, Belarus, and so on, and by the fact that infections were falling in England in March before lockdown. But the belief will not budge and is impervious to evidence.
Stop Press: Scientists at King’s College have revealed that figures from their survey show a much less alarming picture, one in line with what we’ve been saying at Lockdown Sceptics. The Telegraph has the details.
COVID-19 rates are not surging, researchers at King’s College have said after results from its symptom tracker app showed a far less deadly virus trajectory than Imperial College findings.
Earlier in the week, Imperial released interim data from its React-1 study which showed there are now nearly 100,000 new coronavirus cases a day in England, with nearly one million people infected. The Imperial team said rates were doubling every nine days and it was a critical time for lowering the ‘R’ rate.
However, King’s College – which has been monitoring the symptoms and test results of millions of people through its app – said it was not seeing such alarming numbers. The app found 43,569 daily new symptomatic cases on average, and calculated that doubling was happening every 28 days.
Tim Spector, professor of genetic epidemiology at King’s College, said: “While cases are still rising across the UK, we want to reassure people that cases have not spiralled out of control, as has been recently reported from other surveys. We are still seeing a steady rise nationally, doubling every four weeks – with the possible exception of Scotland, which may be showing signs of a slowdown.
“With a million people reporting weekly, we have the largest national survey and our estimates are in line with the Office for National Statistics (ONS) survey. We can’t rely simply on confirmed cases or daily deaths without putting them into context. Hospital admissions are rising as expected, but deaths are still average for the season.”
This survey is the largest of the Government’s surveys and chimes with the ONS data and daily testing data. The Government should be heeding Professor Spector (watch him here) and his team. But instead they appear yet again only to have ears for the doom-mongers at Imperial and on SAGE.
By
https://lockdownsceptics.org/


