
More deception: KDHE hid data to justify mask mandate
Sun 10:21 am +01:00, 23 Aug 2020Data obtained in an Open Records request from the Kansas Department of Health and Environment shows KDHE didn’t ‘just’ manipulate data to justify a mask mandate; they also hid data showing that counties with mask mandates had a large increase in cases before tapering off.
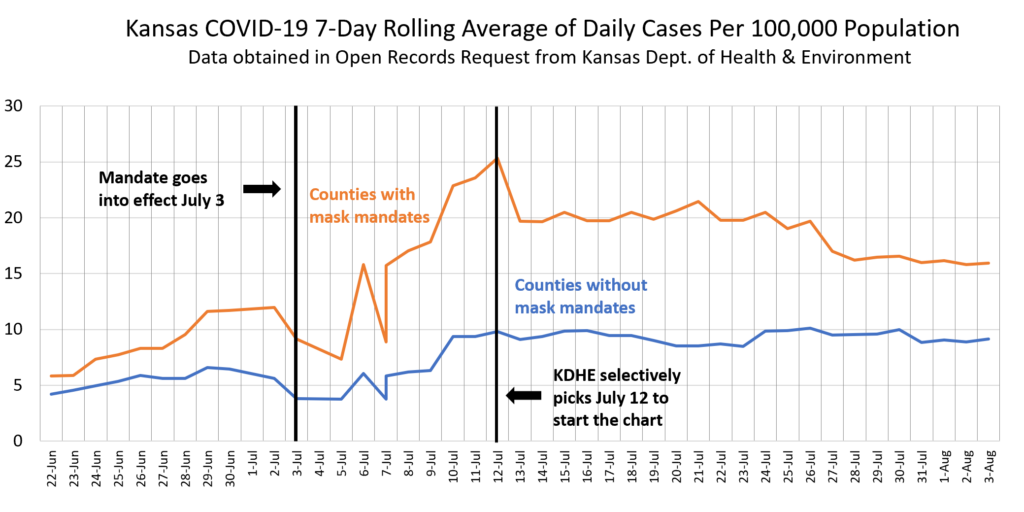
Last week, KDHE presented a chart that appeared to show that counties with a mask mandate had fewer cases than counties without the mandates.
The KDHE strategically chose to begin the chart on July 12 even though Governor Kelly’s mandate went into effect on July 3. An Open Records request from the Sentinel’s parent company, Kansas Policy Institute, compelled KDHE to produce the data, which reveals what KDHE didn’t want reporters and citizens to know – they selectively picked the day with the peak number of cases to start showing the data.
The nine days that were hidden from the public were July 3-11, during this time the number of average daily cases per 100,000 people in the mandate counties jumped from 9.1 per day to 25.3 per day. The 7-day rolling average then dropped to 19.7 on July 13, which KDHE Secretary Dr. Lee Norman would have Kansans believe is solely attributable to a mask mandate. Not wearing a mask, mind you; a mask mandate.
The Sentinel asked KDHE why they didn’t start their chart on July 3 but they didn’t respond.
It’s obvious that showing all of the data would raise questions that KDHE and the Kelly administration didn’t want to answer, including:
- Why did cases increase more rapidly between July 3 and July 12 in counties with mandates?
- Why did the counties without mask mandates always have fewer cases per 100,000 than the counties with mandates?
House Majority Leader Dan Hawkins (R-Wichita), who has been had his own transparency issues with the Kelly administration, says this latest development shows Kansans were deceived to further the governor’s agenda.
“Accurate data can be presented in a way to mislead. It’s become abundantly clear that is the situation here. Between the misleading nature of the chart and the selective timing of when the chart began, the Kelly administration was attempting to paint a misleading picture. A fair presentation of the data shows that Kansas is not a one-size-fits-all state. Unfortunately, the Kelly administration would rather double down on their discredited policies rather than have an honest conversation with Kansans.”
Norman’s condescension insults Kansans
Dr. Norman doesn’t believe he did anything wrong and even went out of his way to insult people who weren’t smart enough to understand his chart. KSHB-TV reports that Norman earlier this week told reporters, “I know that my graph was misunderstood and, in retrospect, I would redraw it different the next time, because those of us that are scientists and financial people understand that when you have two different axes working at the same time that our eyes attract to that,” KSHB reports Norman said.
People across Kansas expressed outrage on social media about Norman’s deception, and even Principia Scientific, an international community of impartial scientists said KDHE used “faked data to push a mask mandate.”
This video produced by the Sentinel’s parent company, Kansas Policy Institute, shows how they deceptively manipulated the data.
Not an experiment or scientific study
Dr. Norman talks about his ‘experiment’ on the efficacy of mask mandates as though he conducted a scientific study. KSHB-TV reports that Norman earlier this week told reporters, “There’s no question the data is solid.”
But according to Kansas Policy Institute economist Michael Austin, a scientific study to determine whether mask mandates cause the number of cases to decline would be conducted so that the mandate was the only variable. In this case, however, each of the 105 counties in his two control groups are wildly different. In both groups, there are rural counties with low population density, urban counties with high density, counties with many cases and no cases, and counties with and without outbreaks in nursing homes and other isolated clusters, just to name a few.
The use of masks themselves is another huge variable. A county may have a mandate, but that doesn’t mean everyone in the county complied with the mandate; similarly, a lot of people wore masks in counties that didn’t have a mandate.
Hawkins says one-size-fits-all mandates are wrong for Kansas.
“The legislature made the right decision when it gave county commissions the authority to opt out of the Governor’s mandates and the data from KDHE proves it.”


