
Understanding Covid-19
Mon 10:15 am +01:00, 29 Jun 2020How serious is Covid?
- Covid is less serious than the 1968/1969 flu
- Winter flu/respiratory seasons have claimed more lives than Covid
- If you catch the virus your risk of dying this year is approximately unchanged
- Mortality rates calculated for 2020 are similar to recent years
- The virus mostly kills older people with existing serious illnesses
- Covid infections are trending downwards into oblivion
- The UK Government’s response to Covid has been a mistake of historic proportions
In March 2020 the UK decided upon an unprecedented policy of strict lockdown. Many take it for granted that this policy must have helped in the fight against Covid, while others question was it was proportionate or even effective at all. To determine the appropriate response to Covid, we must assess how serious a threat it is.
Covid is less serious than the 1968/1969 flu
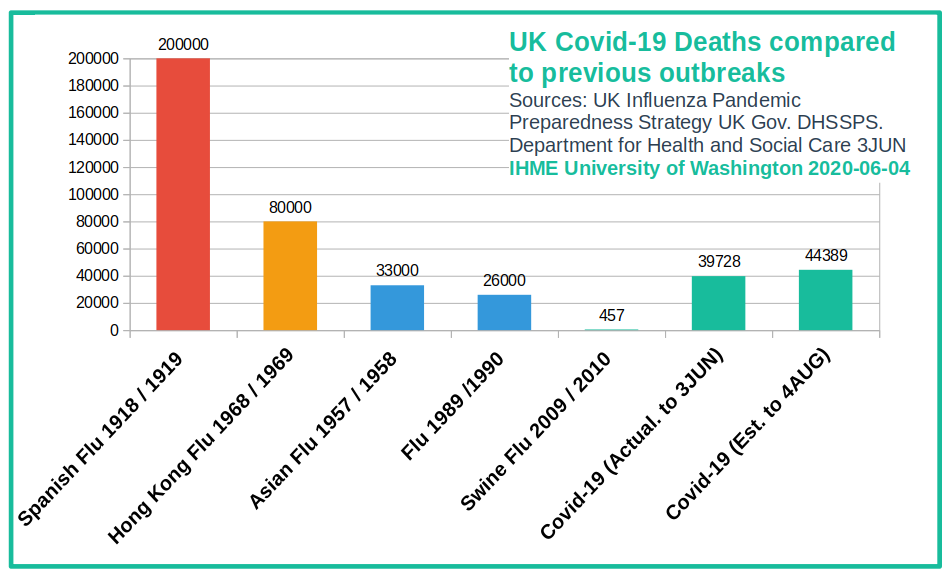
Covid is less serious than the “Hong/Kong Flu” of 1968/1969 when there was no lockdown.
In reality the numbers dying from Covid have frequently been exceeded in the past by “normal” excess winter deaths.
Those years are remembered for things like the Moon Landings, the Woodstock music festival or its little cousin the UK’s Isle of Wight festival. Hospitals were not closed to cancer patients and economic growth continued steadily at a decent average of 3.5%

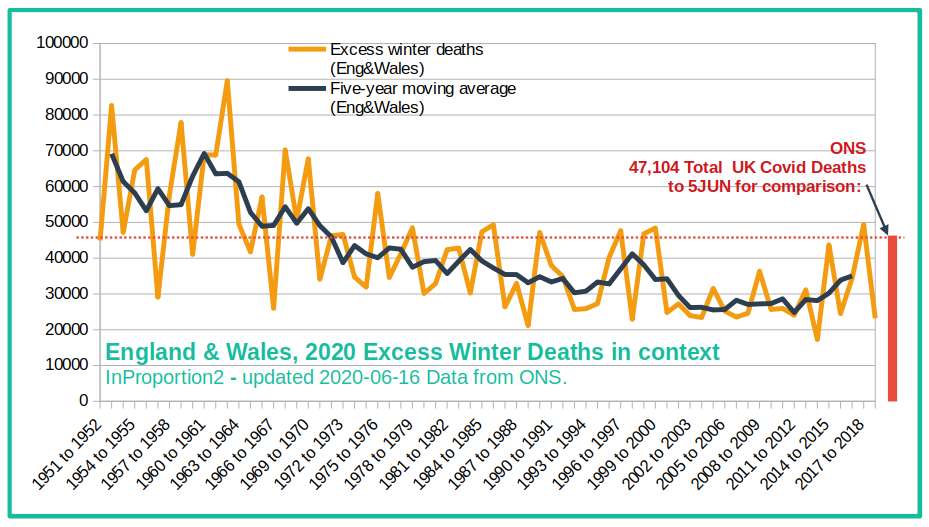
Winter flu/respiratory seasons have claimed more lives than Covid
Excess winter deaths give an idea of the number of additional deaths that occur in the four winter months, typically due to the extra deaths from flu and respiratory disease [1].
Often the media will compare the number of people dying from Covid with the average numbers that usually die during April and May in the last five years. This comparison will make Covid look bad, as
- a) the average hides how spiky the data is and
- b) excess deaths usually happen in the winter months, while Covid has struck the UK at the end of the winter.
If you catch the virus your risk of dying this year changes only very slightly.
(Note this is based on real data, not estimates or forecasts)
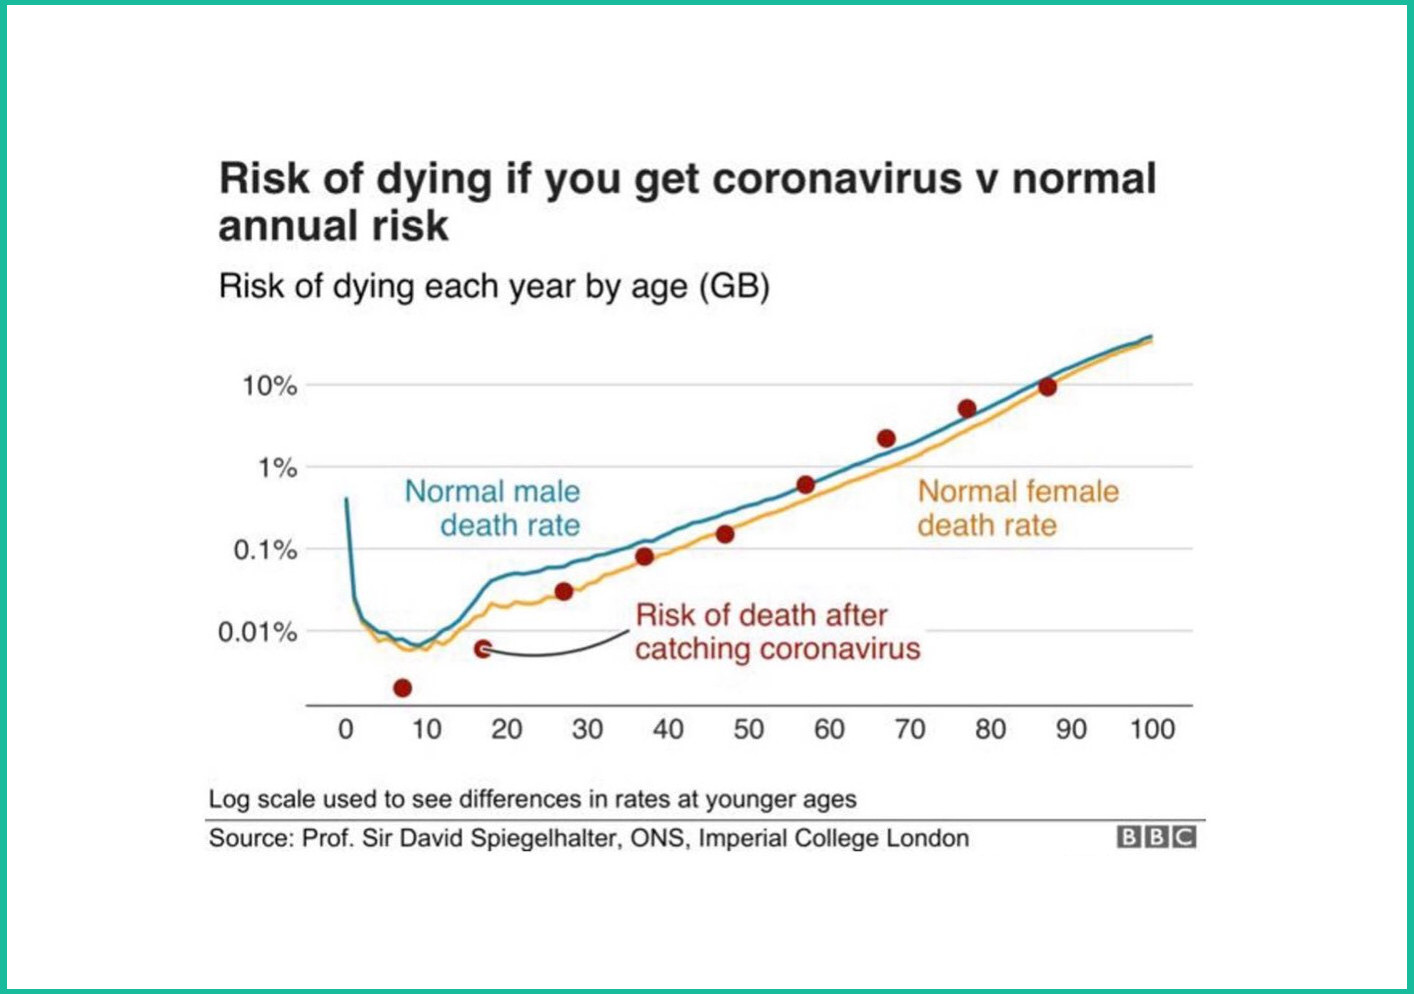
Nobel Prize winner Professor Michael Levitt has analysed the data used by the above chart and explains that whatever your risk is of dying this month is, if you become infected with Covid, you need to add another month’s worth of risk.
So this year, instead of the normal 12 months of risk for your age group, if you catch Covid you will then have 13 months of the risk that is normal for your age and gender.
Consider the risk of taking 12 car journeys – road accidents are often fatal – and then having to add the risk of a 13th journey. Most of us would not give a thought to this rise in our “normal” risk. Professor Levitt continues with the following comment:
“Thus, the Western World has been encouraged by their lack of responsibility coupled with uncontrolled media and academic errors to commit suicide for an excess burden of death of one month. Surely we or someone we know can do something about this!” [5]
Mortality rates calculated for 2020 are similar to recent years
The following chart shows mortality rates from 1980 to a previously projected figure for 2020 (light blue) and an annualised figure based on actual data to 15 May (green). Data is organised in age bands from 60 to 90. (Calculated by Paul McGlone, partner at life insurers Aon [3]). Note that “mortality rate” is the risk of death in a single year.
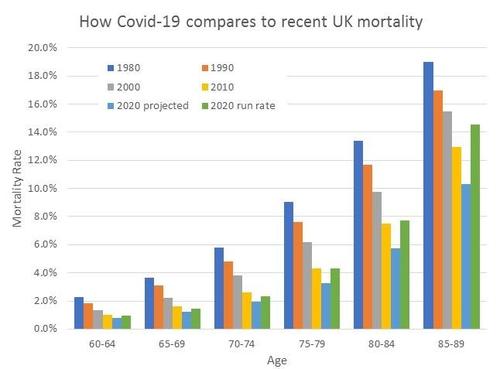
The chart shows that, even if Covid continues to claim lives for the rest of the year without improving, if you are under 85 your mortality rate will be very similar to previous years. For the over 85’s, mortality rates in 2020 will still be better than they were in 2000.
The virus mostly kills older people with existing serious illnesses
If you are under 40 and healthy, the risk of dying from Covid is tiny.
210 people under the age of 40 have died from Covid in NHS hospitals up to 04JUN, this compares to around 400 dying each year in accidental drownings (UK all ages).
The following chart shows how the vast majority of people killed by Covid are older people with pre-existing health conditions. Nearly half of people dying from Covid have three or more illnesses quoted on their death certificate such as cancer, heart disease and dementia].
See also: Six key charts that can help us get Covid in proportion
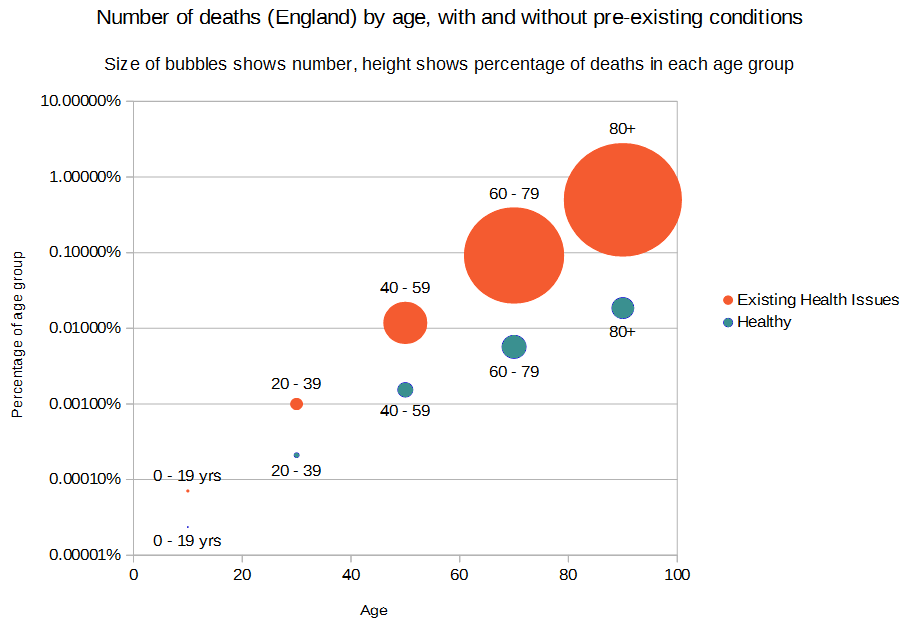
(Thanks to twitter user scotpolitik for this chart from 2020-06-02, data from NHS England)
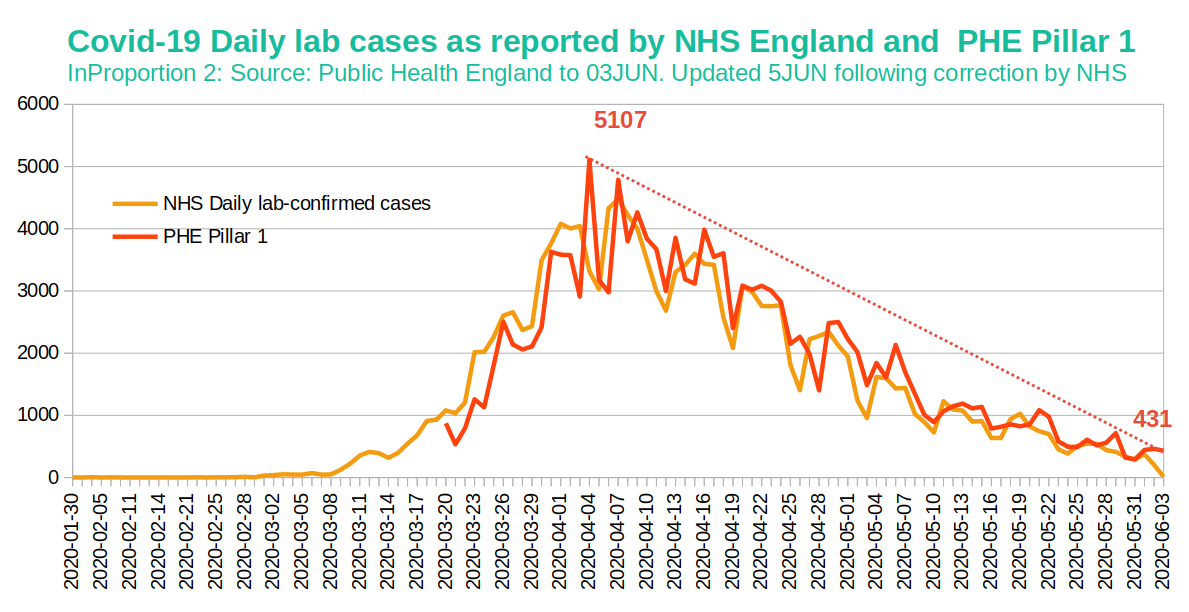
Covid infections are trending downwards into oblivion
The statistics presented by the Government have been severely criticised by the UK Statistics Authority for falling who say “The aim seems to be to show the largest possible number of tests, even at the expense of understanding” and overall the statistics are “well short of its expectations” [2].
See also my own analysis:
The UK Government is misleading when it presents the trends
The so called “pillar one” testing data provided by the NHS covers testing carried out in NHS hospitals and exclude tests carried out by third parties and swabs mailed out en masse by the Government. It is arguably a more reliable data source than other government output and gives a crystal clear impression: Covid is disappearing into oblivion. [4]
The UK Government’s response to Covid has been a mistake of historic proportions
Covid is not so different from previous outbreaks we have suffered and has not justified a social and economic lockdown that will inevitably result in:
- Earlier deaths for cancer sufferers due to diagnosis and treatment delays
- Business failures leading to more business failures
- Job losses leading to poor health, social problems and suicides
- Fewer taxpayers available to fund an increasing need for social benefits
- Reduced funding for the NHS and the rest of the public sector
- Lost educational opportunities and disruption to exams and graduations
- Inflation as Government “prints” and “borrows” more, while tax revenues fall
- Pension values reduced by stock-market crashes
- Reduced life expectancy for people moving deeper into poverty
More Articles on
http://inproportion2.talkigy.com/pages/covid.html


