Oxford Professor: Covid Cases in England Are Not Rising
Mon 2:05 pm +01:00, 3 Aug 2020
Carl Heneghan has struck again. The Professor of Evidence-Based Medicine at Oxford wrote a blog post yesterday in which he showed that the alleged increase in the number of infected people in England – the pretext for locking down four-and-a-half million people last week – is an artefact of increased testing.
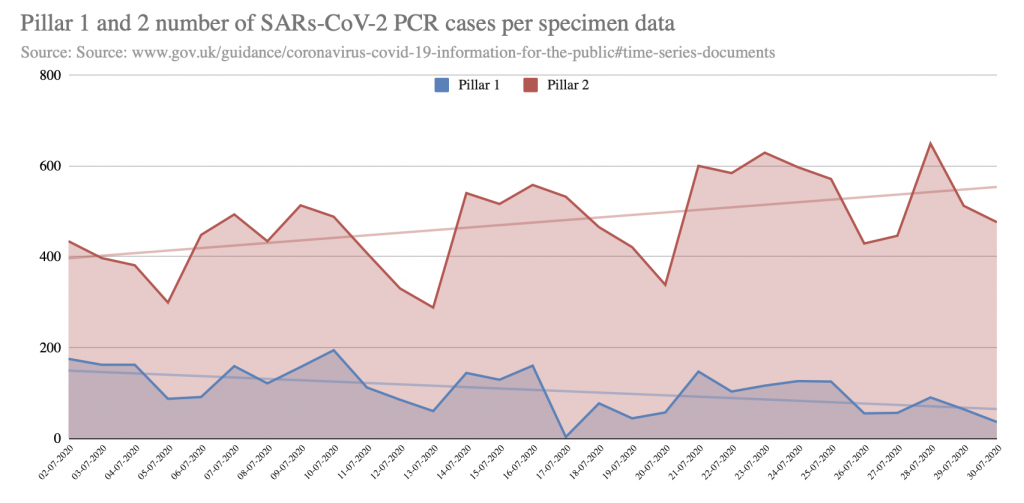
First, he looks at the raw data which seems to show the number of positive cases in Pillar 1 (testing in healthcare settings) trending down and the number in Pillar 2 (community settings) trending up.

That alone is sufficient to demolish the case for imposing more restrictions – if an uptick in community cases isn’t resulting in an uptick in healthcare cases, then it’s nothing to worry about. But Prof Heneghan then goes on to show that the increase in the number of Pillar 2 positives is entirely a function of increased Pillar 2 testing.
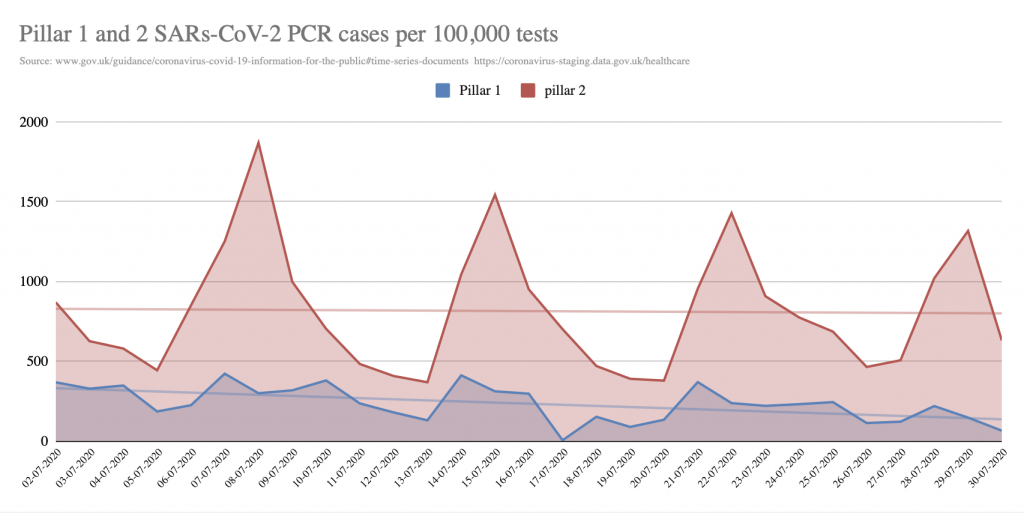
However, what happens if you adjust for any change in testing over time? On July 1st – the seven day moving average of testing was 41,109 for Pillar 1 and 43,161 in Pillar 2. By July 31st, the Pillar, 1 seven day average for testing had increased to 49,543 (a 20% increase); while the Pillar 2 had risen by much more – by 82% to 78,522 tests.
The next graph shows what happens when you adjust for the number of tests done and then standardise to per 100,000 tests. Pillar 1 is seen to be still trending down, but Pillar 2 is now flatlining. The increase in the number of cases detected is likely due to the increase in testing in Pillar 2.

Prof Heneghan’s conclusion – typically understated – is that the Government doesn’t know its arse from its elbow.
Inaccuracies in the data and poor interpretation will often lead to errors in decisions about imposing restrictions, particularly if these decisions are done in haste and the interpretation does not account for fluctuations in the rates of testing.
Heneghan also gave an interview to the Telegraph‘s Science Editor Sarah Knapton yesterday in which he said the apparent increase in cases in Greater Manchester, east Lancashire and parts of West Yorkshire disappears if you control for: (a) the date the tests were taken rather than when the results came through; and (b) the increase in Pillar 2 testing.
“The northern lockdown was a rash decision,” he said. “Where’s the rise? By date of test through July there’s no change if you factor in all the increased testing that’s going on.
“As areas are tested, like Oldham, then there’s a slight rise in detected cases, asymptomatics.
“It’s not clear if these are false positives, or if these folk have viable virus or just RNA fragments detected by a test threshold that picks up minute traces of RNA.
“While you get these small clusters, which will have been occurring for some time, they have not led to an overall increase in cases
“The Government needs to allow the local public health teams to do their job when localised clusters emerge.”
Mapping the coronavirus trend by result date appears to show a slight increase in cases over the past few weeks, but based on specimen date – a more reliable measure – cases appear to have plateaued and may even be falling.
Between July 22nd and July 29th the seven day rolling average of reported cases jumped between those two dates from 659 to 753 – 16.7%.
However, when judged by specimen date the seven day rolling average actually dropped from 641 to 442, a 31% decrease.
Any rise is also being skewed by a general increase in testing. The seven-day rolling average for tests carried out between July 22nd and July 29th jumped from 137,427 to 153,252 – an 11.5% increase, wiping out much of the increase.
“Why is no one checking this out at Government level?” added Prof Heneghan
“The specimen date is more reliable as the reporting data will be skewed by the delay in Pillar 2 testing reporting.”
By / 3 August 2020
https://lockdownsceptics.org/


