Why is the UKs Covid-19 CFR the highest in the world by wide margins?
Wed 10:10 pm +01:00, 1 Jul 2020I was churning some data on the UK Covid-19 when something seemed odd. The ratio between new cases and deaths seemed oddly stable. So, I dug some more ….
Soon I found something else that does not seem right about Covid-19 data ….
UK cases per day are down from circa 1500 per day to ~750 per day over the month of June. deaths are down from ~210 per day to ~105 per day.
So just over one death in seven cases, if lags are ignored. At the peak, it was ~5600 cases and ~900 deaths, giving a ratio of 8.
I had thought that once all the mayhem over Care Homes and Nursing Homes was over, the UK numbers would improve, but that does not appear to be happening.
So, maybe have a look at the USA, and see if that tells a tale?
In the USA, daily new cases took off at the beginning of June, from ~20,000 to ~40,000 per day over this month.
And deaths? they fell from ~700 to ~500 per day. Their ratio went from one in 30 to one in 80.
We know most of the increase in cases are in the 20-30 years old bracket, so there’s some explanation for that. The USA Ratio back in April when New York was in the headlines for mismanagement of Care Homes, and within Hospitals, was one in 15.
Where else to look? France?
French new cases peaked in early April around 4000 per day, and deaths at around 1000, so more fatalities and a ratio of 4.
The French epidemic was pretty much over at the start of June. That’s now averaging 550 new cases and 22 new deaths. A ratio of 25.
The Lockdown is all but over in France.
All very odd. You would think if the UK was breaking records the BBC would be all over this.
Maybe there was something on the internet, for example here: https://coronavirus.jhu.edu/data/mortality
And there’s a graph:
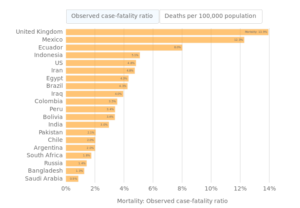
Somehow nobody noticed this? Nobody thought to ask why? Where are the Answers?